Mössbauer Spectrometer
|
Mössbauer Spectrometer |
The Mössbauer Effect depends on the fact that suitable nuclei embedded in a sufficiently stiff atomic matrix emit very highly monochromatic radiation. In this case the source was Cobalt 57, which decays by beta emission to Iron 57 in a highly excited state. This reverts to its ground state by emitting a 14.4 Kev gamma photon. This radiation is the basis of Mössbauer spectroscopy. It is so monochromatic that it can be scanned across the energy range of interest by Doppler shift. Our spectrometer was constructed by mounting the source on the centre of a 10" hi-fi speaker driven at it's resonant frequency, giving a maximum source velocity of a few mm/sec. The radiation was sufficiently monochromatic that the spectrometer had a resolution of the order of 10-4 electron volts, or a Doppler velocity of the order of 0.1 mm/sec.
The experimental set-up placed the sample between the source and a scintillation counter (PM tube). A schematic is shown below. The spectroscope, which was built by the Chemistry Department, was quite sensitive to vibration, so the source, scanning mechanism and sample holder assembly was isolated by supporting it on tennis balls.
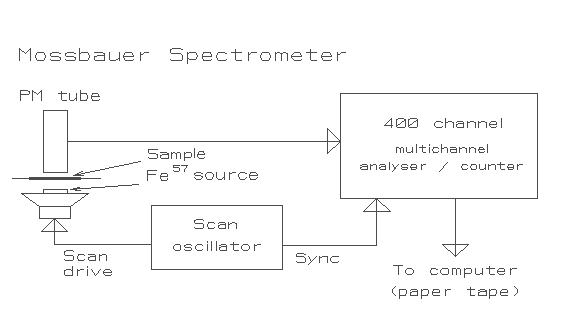
A Mössbauer spectrometer is essentially a statistical device. The Scan oscillator drove the spectral scan (in our case by driving the speaker on the assembly's resonant frequency to ensure a sinusoidal velocity distribution) and simultaneously provided a synchronising input to the multi-channel analyser. The analyser was stepped at 400 times the speaker's drive frequency so that each channel was recording the same time division (and hence velocity) for the positive half of the velocity cycle. When the Doppler shift causes the emitted energy to exactly match energy levels in Iron 57, which forms 2% of natural iron, the radiation is adsorbed. This causes a drop in the count rate seen by the PM tube and recorded in the corresponding channel of the multi-channel analyser. The system was allowed to run until several thousand counts had been accumulated, thus generating a somewhat noisy statistical spectrum. Initially I used an existing pair of programs to analyse the data, which was dumped to paper tape for input to the university's Elliott 503 computer. They were:
Both programs were written in Elliott Algol 60 with assembler matrix handling procedures. It quickly became apparent that the curve fitting program, which processed the complete spectrum and automatically located adsorption peaks, had problems separating overlapping peaks. As a result I carried out a major rewrite to correct this problem. My final version:
The program used the input estimates to correct for the effect of neighbouring peaks during each fitting attempt. As the entire process was iterative the program was insensitive to the accuracy of the estimated peak shapes and positions; only the number of peaks specified was critical.
The revised program produced stable fitted curves from data sets that the original was totally unable to process. These were typically triplets with shoulder peaks less than 2 standard deviations away from the centre peak.